Hospitality executives are often asked to make high-stakes digital decisions with low-fidelity quality data.
They receive status reports showing how many test cases passed, how many defects remain open, and whether QA has signed off on a release. They may see spreadsheets from different testing tools, defect trackers, automation suites, monitoring dashboards, and infrastructure systems. They may hear anecdotal updates from product, engineering, operations, or property teams.
But these reports rarely answer the questions that matter most to the business.
Is the booking funnel commercially safe?
Are PMS, GDS, CRM, loyalty, payment, and distribution systems synchronized?
Are guest-facing workflows ready for peak demand?
Which parts of the architecture are under-tested?
Where will a defect create the greatest operational impact?
Is the release ready, or are we flying blind?
Traditional QA reporting was not designed to answer these questions. It was designed to report testing activity.
Modern hospitality leaders need something more useful: a real-time, release-cycle view of quality that translates technical signals into business control. That is the role of the Quality Command Center (QCC).
Built on mroads' proprietary Paññā AI platform, QCC turns Quality Engineering telemetry into decision-ready insight: release readiness, coverage visibility, defect and root-cause signals, performance health, and quantifiable ROI — combined into a single evidence-based dashboard.
The Problem with Static QA Reporting
Most QA reports are backward-looking. They tell leaders what happened during a test cycle: test execution counts, defect counts, pass percentages, severity levels, sign-off status.
This information matters, but it is incomplete.
A test pass rate does not tell an executive whether the most important guest journeys are protected. A defect count does not show whether the defect affects revenue, guest trust, or property operations. A green dashboard from one tool does not prove that the full hospitality ecosystem is ready.
This is especially true in hospitality, where a single workflow may cross many systems. A mobile check-in release may involve the mobile app, identity service, PMS, payment gateway, room assignment logic, digital key provider, notification service, cloud infrastructure, and property network. Each system may show a healthy status independently, while the overall guest journey still carries risk.
That is why static QA reporting can create false confidence. It shows testing status, but not business readiness.
Static QA Reporting | Quality Command Center |
|---|---|
Test pass/fail counts | Business risk and release readiness scoring |
Spreadsheet-based reporting | Real-time, evidence-based analytics across the software lifecycle |
Tool-specific views | Consolidated view across functional, automation, performance, defect, and release data |
Defect lists | Root-cause insight and AI-assisted RCA |
Manual status updates | Role-based views for delivery teams, TCoE leadership, business, and executive sponsors |
Backward-looking summaries | Decision-ready, closed-loop improvement engine |
QA activity metrics | Automation Velocity, Process Maturity & Reuse, and Resource & Skill Mix signals |
The shift is not cosmetic. It changes the purpose of quality reporting. The question is no longer, Did QA finish testing? The question becomes, Can the business trust this release?
From Reporting to Command Center
A dashboard should not merely display data. A strong QE dashboard should function like a control center.
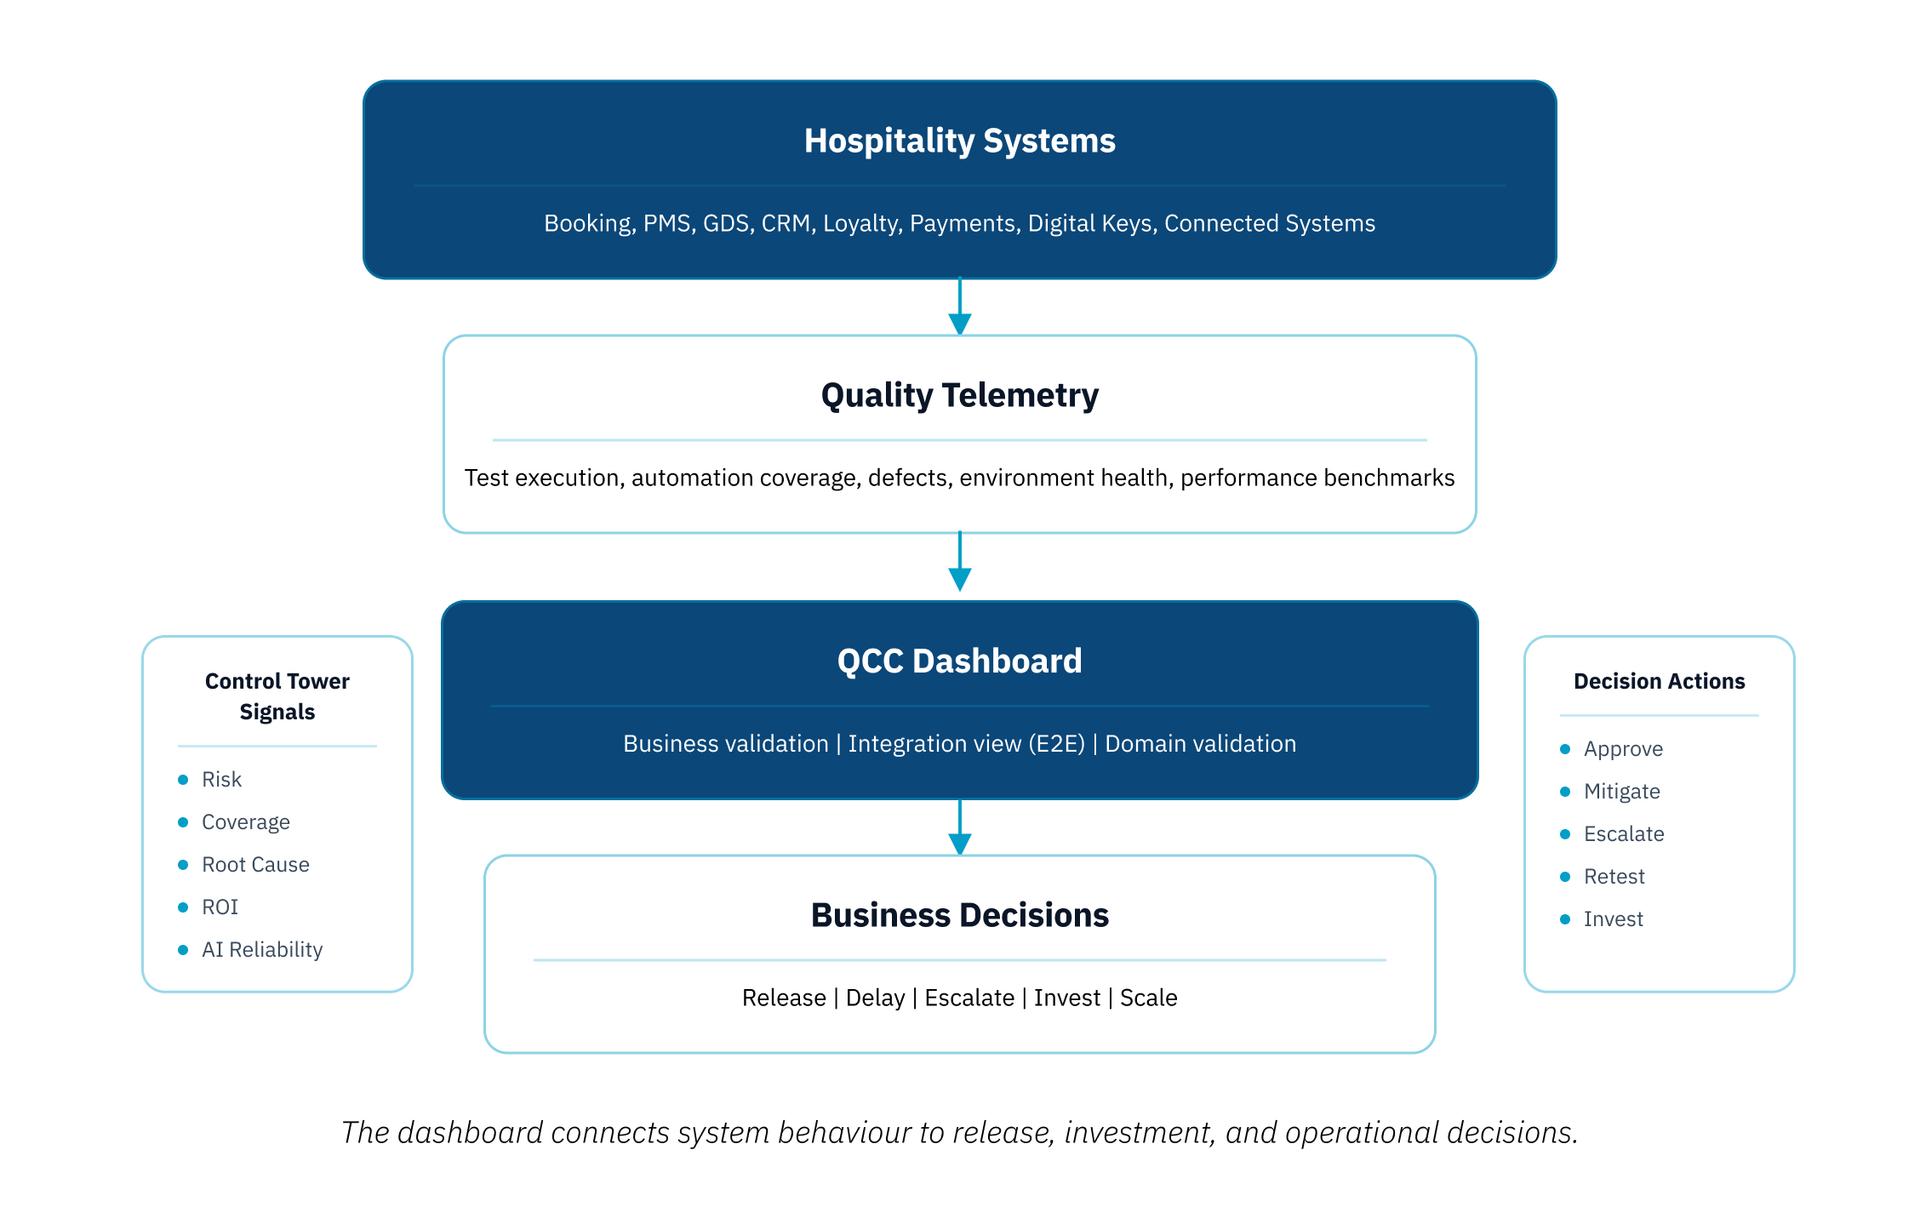
The Quality Command Center collects quality signals from test automation, API validation, defect systems, logs, environment health checks, performance tools, and production feedback. It then translates those signals into meaningful views for different stakeholders.
Executives need to understand release readiness, business risk, and year-over-year efficiency gains.
Business and QA stakeholders need to understand release health, coverage, and defect trends.
Engineering teams need to understand root cause, environment stability, and performance health.
TCoE and delivery leadership need to understand automation effectiveness, regression optimization, and continuous-improvement progress.
The same telemetry serves different decisions. That is what makes QCC different from a traditional QA report.
Turning fragmented system signals into decision-ready business control:
What the Quality Command Center Measures
A useful QE dashboard should not be a cluttered screen of disconnected metrics. It should organize signals around the decisions leaders need to make.
The Quality Command Center focuses on five core areas:

Together, these areas create a practical model for business control.
1. Release Readiness & Risk Heatmap
Release readiness is judged across business, product, technical, and operational signals — not simply whether testing is complete.
QCC's Release Health Summary combines release readiness scoring, test execution results, defect severity, and an AI-predicted risk heatmap that maps likelihood against business impact. In recent enterprise engagements, this view has supported release maturity scores in the 90%+ range, giving stakeholders a single evidence-based readiness signal rather than a collection of separate tool reports.
Readiness Area | Dashboard Question |
|---|---|
Business readiness | Are revenue-critical workflows safe? |
Product readiness | Are guest and operator journeys usable and low-friction? |
Technical readiness | Are APIs, services, data flows, and integrations reliable? |
Environment readiness | Is Dev, SIT, UAT, Staging, and Production availability stable? |
Operational readiness | Are defect ownership, escalation, and rollback processes in place? |
2. Definitive Coverage Mapping
Coverage is one of the most misunderstood concepts in QA. Many teams report coverage as a single percentage — a number that can be misleading if the most business-critical workflows remain under-tested.
QCC treats coverage as a map, not a vanity metric. It breaks coverage down by test level (unit, API, UI, service, E2E), by automation portfolio (UI automation, API automation, service virtualization), and by business workflow. In one enterprise implementation, this approach supported 80%+ automation coverage across a 10,000+ test case portfolio, with automation adoption tracked continuously rather than reported once per release.
Coverage Area | What the Dashboard Shows | Why It Matters |
|---|---|---|
Booking journey | Search, select, reserve, pay, confirm | Protects core revenue flow |
PMS synchronization | Reservation state, room assignment, availability | Prevents operational mismatch |
Loyalty workflows | Eligibility, offer redemption, points, tier benefits | Protects guest trust and retention |
Payment workflows | Authorization, capture, refund, failure handling | Reduces financial and guest-impact risk |
Mobile & digital key | Identity, reservation, room assignment, key issuance | Protects arrival experience |
Channel distribution | Rate parity, availability, integration payloads | Prevents revenue leakage and booking errors |
This makes vulnerability visible. Leaders can see not only what was tested, but which parts of the architecture remain exposed.
3. Root-Cause and Defect Intelligence
Hospitality defects rarely stay inside one layer. A guest-facing issue may begin with a front-end change, but the root cause may sit in an API contract, a queue delay, a database lock, or an environment instability.
QCC's defect and root-cause layer — powered by AI-assisted analysis within the Paññā platform — helps teams answer:
Which workflow failed, and which system first showed abnormal behavior?
Was the issue caused by a new deployment or an upstream dependency?
What is the mean time to resolution, and is it improving release over release?
In recent engagements, AI-assisted RCA has helped reduce defect mean-time-to-resolution by roughly 40%, and the same accelerator library has supported production defect leakage below the 2% range prior to release sign-off — consistent with the Sev1/Sev2 quality thresholds mroads holds itself to at Stage and Production gates.
Without root-cause mapping, teams investigate symptoms. With it, teams investigate causes.
4. Quantifiable ROI
Quality Engineering must be measurable as a business investment. QCC tracks ROI signals in the language executives use to evaluate any investment: time, cost, risk, and release velocity.
ROI Signal | What It Measures | Business Value |
|---|---|---|
Regression cycle reduction | Time saved through automation and reusable assets | Faster release cycles |
Faster test case generation | AI-assisted authoring versus manual creation | Lower delivery drag |
Defect leakage trend | Fewer severe issues reaching later stages | Higher guest trust, lower incident cost |
Automation coverage growth | Percent of regression suite automated over time | Healthier automation investment |
UAT cycle time reduction | Time to business sign-off | Faster time-to-market |
Year-over-year efficiency | Productivity gains against agreed baselines | Predictable, compounding cost efficiency |
Across engagements, this model has supported outcomes such as 40%+ faster test case generation, meaningful reductions in regression and validation cycle time, and double-digit year-over-year efficiency gains — tracked transparently through the same dashboard used for release decisions, not through a separate business case.
5. AI-Enabled Quality Intelligence
QCC's intelligence layer is built on mroads' Agentic Framework — an approach that combines AI-assisted workflows, reusable accelerators, and human-led governance across the testing lifecycle.
AI is applied to requirements and scenario generation, test case review, regression impact analysis, defect triage, test data support, and self-healing automation maintenance. Every AI-generated suggestion, script change, or data action passes through engineer review and approval gates — human oversight is embedded at every step, not bolted on afterward.
A separate and emerging capability worth watching across the industry: as hospitality platforms adopt AI-driven guest-facing features — dynamic pricing, personalized offers, demand forecasting, guest service chatbots — these features introduce a different quality question. Traditional tests confirm whether a feature runs; they do not confirm whether an AI-driven recommendation remains accurate, unbiased, or aligned to business rules over time.
This is where Model Evals become relevant — structured evaluation of AI output reliability, drift, and business-rule alignment, distinct from using AI to accelerate testing itself. mroads sees this as the next extension of the QCC model as more hospitality platforms adopt AI-driven guest experiences, applying the same human-in-the-loop governance principle that already anchors the Agentic Framework.
One of the most important capabilities of the Quality Command Center is role awareness. An executive does not need to see every failing assertion in an automation suite. A QE engineer does. A product owner cares about guest journey completion and feature readiness. A delivery leader cares about automation effectiveness and cost of quality.
QCC organizes this through three consistent views — Business validation, Integration view (E2E), and Domain validation — so every stakeholder reads the same underlying data at the altitude relevant to their decision.
Role | Needs to See | Decision Supported |
|---|---|---|
Executive leadership | Release readiness, risk heatmap, YoY efficiency | Offer recommendations remain relevant to guest profile |
Business & product stakeholders | E2E scenario pass rate, guest journey coverage, feedback trends | Pricing recommendation does not violate rate rules |
Engineering & QE leadership | Automation portfolio, environment health, defect RCA | Demand model accuracy changes during event season |
TCoE / governance stakeholders | Compliance adherence, SLA performance, continuous-improvement trend | Pricing model receives stale inventory signals |
This is how quality data becomes business control.
Role-Aware Views: The Same Data, Different Decisions
One of the most important capabilities of the QCC Dashboard is role awareness.
Different stakeholders need different views of quality.
An executive does not need to see every failing assertion in an automation suite. A QE engineer does. A product owner may care about guest journey completion and feature readiness. An architect may care about service dependencies and root cause. A CFO may care about QE ROI, cloud cost trends, and delivery efficiency.
The dashboard should not force every role into the same report.
Role | Needs to See | Decision Supported |
|---|---|---|
Executive leadership | Release confidence, revenue risk, business continuity, ROI | Release, delay, invest, scale, or mitigate |
Product leadership | Guest friction, journey completion, feature readiness | Prioritize fixes, refine experience, approve launch |
Engineering leadership | API health, dependency failures, performance, root cause | Stabilize architecture and remove bottlenecks |
QE leadership | Coverage, automation stability, defect leakage, regression risk | Adjust test strategy and release confidence |
Security leadership | Vulnerability exposure, access risk, data protection signals | Approve or block release based on risk |
Operations leadership | Property readiness, support signals, rollback readiness | Prepare support, training, and operational response |
This is how quality data becomes business control.
What Makes the Dashboard Actionable
A dashboard becomes useful only when it leads to decisions. For every major signal, QCC is designed to answer three questions:

This is the difference between visibility and control.
The mroads Perspective
mroads views the Quality Command Center as the operating layer for engineered assurance — the point where the rest of our Quality Engineering practice becomes visible and measurable.
The other layers of our model are all important: risk-based validation, reusable accelerators, AI-assisted engineering through the Agentic Framework, disciplined governance, and a flexible onshore, nearshore, and offshore delivery model. But without a dashboard that brings these signals together, leaders are still forced to interpret quality through fragmented reports.
QCC completes the model. Powered by our proprietary Paññā AI platform, it gives hospitality organizations a central, evidence-based view of quality that is connected to business reality — what's protected, what's exposed, how failures propagate, and whether QE investment is improving velocity and reducing risk release over release.
This is not reporting for reporting's sake. It is business control.
Conclusion
Hospitality leaders cannot manage digital quality through static QA reports. The systems are too connected. The guest journeys are too dynamic. The business impact is too immediate. The rise of AI-driven features adds even more need for traceability and evaluation.
Quality Engineering must become visible in a way executives can act on. The Quality Command Center turns QE signals into business telemetry — connecting tests, automation, defects, environments, performance, and production feedback into a single decision-ready layer.
The result is a more confident release process, a clearer understanding of risk, stronger alignment between technology and business, and better protection for revenue, operations, and guest trust.
The future of hospitality QE is not another static report. It is a Quality Command Center for business control.

Quality Engineering Team